
Summary
Statistical Significance in Email A/B Testing for DTC Brands
Most DTC brands need between 1,000 and 5,000 recipients per variant to reach statistical significance on an email A/B test. The exact number depends on your current conversion rate, the lift you're trying to detect, and which metric you're testing. Smaller lists can still test, but they need bigger expected differences to prove anything.
A/B testing feels simple until you run a test on 400 subscribers and declare a winner based on an 8% swing that's actually just noise. Getting the sample size wrong wastes sends, misleads your strategy, and can quietly tank revenue if you roll out a "winning" variant that never actually won. Inbox competition isn't getting any lighter, and every send needs to earn its spot.
Why sample size determines whether your test means anything
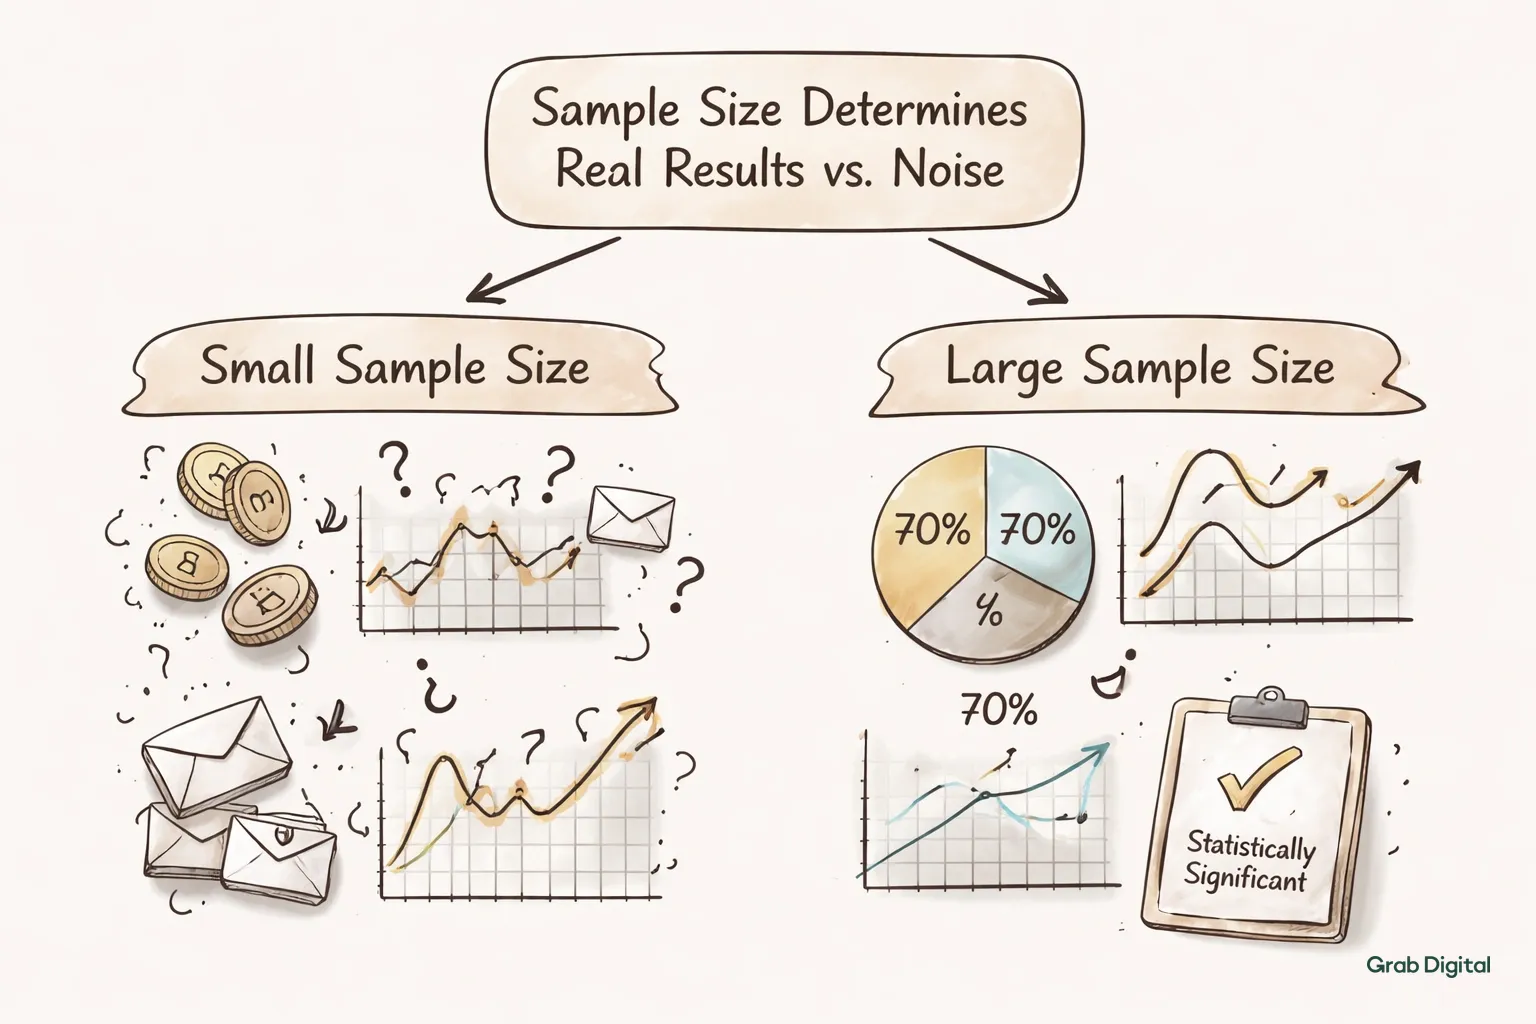
Sample size is what separates a real effect from random chance. Without enough recipients, you can't tell if Variant B's higher open rate is genuine or just noise that would disappear on a second run.
Flip a coin ten times. Getting seven heads doesn't prove the coin is rigged. Flip it a thousand times and a consistent 70/30 split actually means something. Email tests work the same way. Small sample sizes produce wild swings that look dramatic but vanish the moment you retest. A list of 300 people split into two groups of 150 is almost guaranteed to show some difference between variants, even if both subject lines are functionally identical.
I see this constantly. Teams get a 15% lift, get excited, and bake that subject line format into every future campaign. Three sends later, performance is flat and nobody knows why. The answer is usually that the original "win" was never real. A disciplined Klaviyo agency builds testing into campaign strategy specifically to avoid this trap.
The math behind statistical significance
Statistical significance for email A/B tests depends on three inputs: your baseline conversion rate, the minimum detectable effect you care about, and your desired confidence level. Standard practice uses 95% confidence, meaning you accept a 5% chance the result is a fluke.
Here's the simplified formula marketers use, based on a two-proportion z-test:
n = 16 × p × (1-p) / d²
Where:
- n = sample size needed per variant
- p = your baseline conversion rate (as a decimal)
- d = the minimum difference you want to detect (as a decimal)
Let's run real numbers. Say your campaign open rate sits at 25% (p = 0.25), and you want to detect a 5 percentage point lift to 30% (d = 0.05).
n = 16 × 0.25 × 0.75 / 0.0025 = 1,200 per variant
So you'd need 2,400 total recipients just to test opens reliably. Click rate is almost always a smaller baseline number, often 2 to 4%. Smaller baselines need proportionally larger samples to detect the same percentage point lift, which is why click and conversion tests usually demand bigger lists than open rate tests.
Sample size reference table for common DTC scenarios
Here's a quick-reference table based on the formula above, assuming you want to detect a realistic lift at 95% confidence.
| Metric Tested | Baseline Rate | Detectable Lift | Sample Size Per Variant |
|---|---|---|---|
| Open rate | 20% | 5 points | ~1,280 |
| Open rate | 35% | 5 points | ~1,456 |
| Click rate | 3% | 1 point | ~776 |
| Click rate | 5% | 2 points | ~380 |
| Conversion rate | 2% | 1 point | ~3,136 |
| Revenue per recipient | varies | varies | 2,000 to 5,000 typical |
Conversion rate tests require dramatically more volume than open rate tests. That's why brands with under 10,000 active subscribers often struggle to test conversion-level changes on a single campaign. If your list sits below that threshold, you may need to test subject lines (higher baseline, smaller sample) before you can meaningfully test checkout page design or offer structure.
What happens when your list is too small
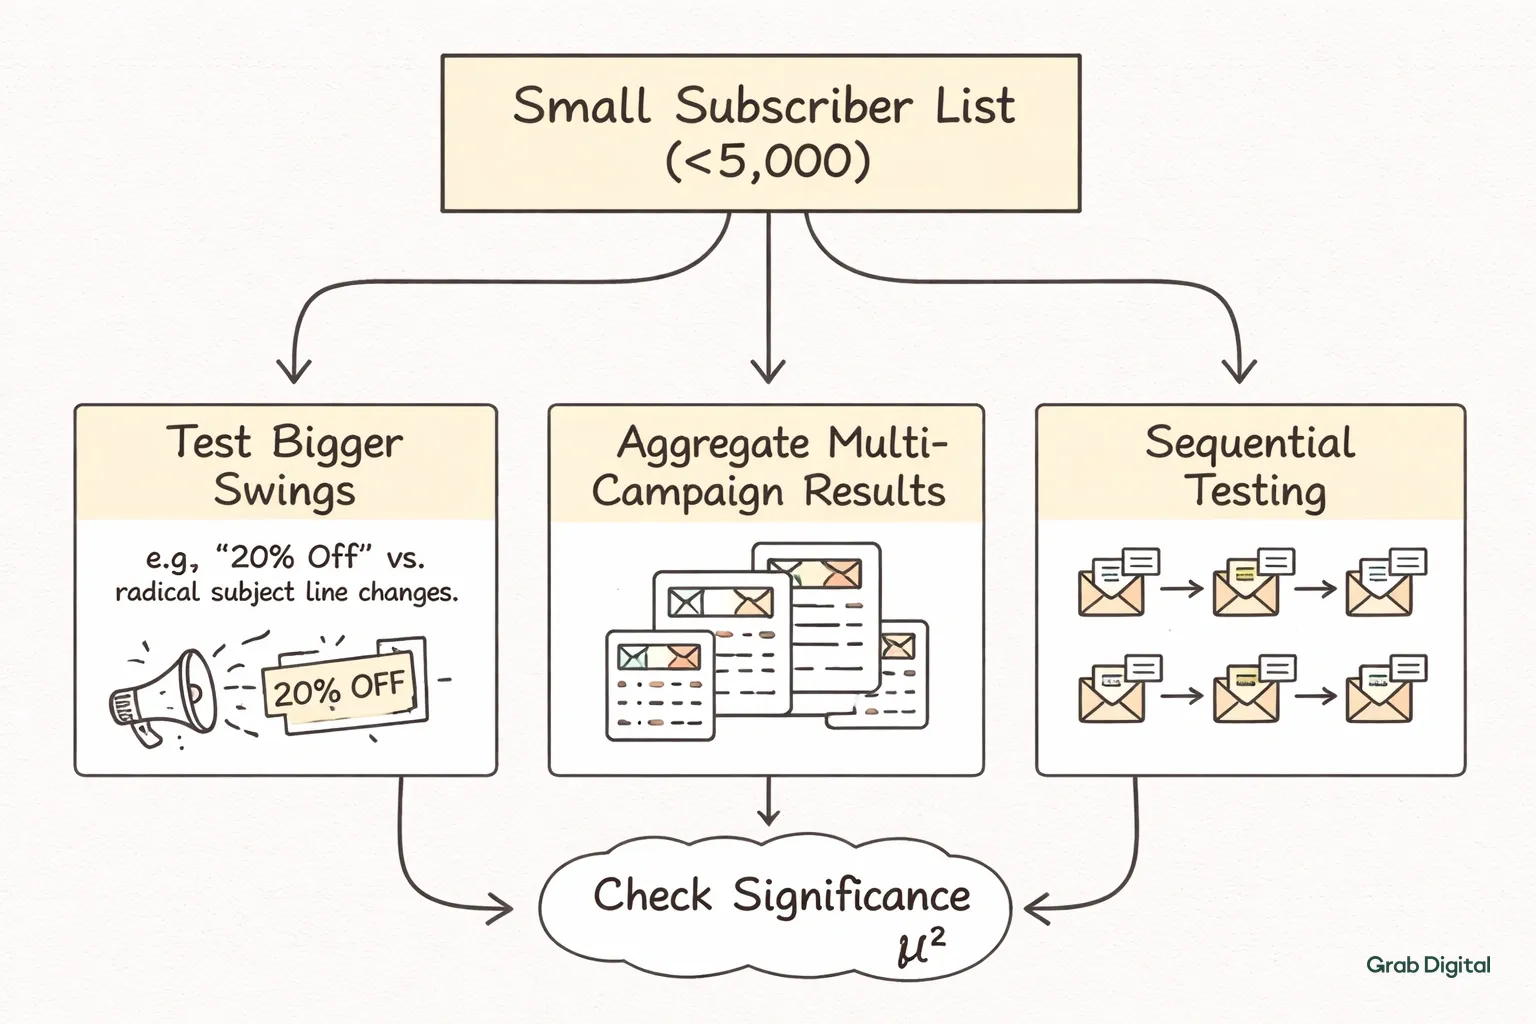
Smaller DTC lists can't reliably test subtle changes within a single send. A list under 5,000 active subscribers needs either a much bigger expected lift to detect significance, or it needs to aggregate results across multiple campaigns before drawing conclusions.
Three practical workarounds. First, test bigger swings instead of small tweaks. Comparing "20% off" versus a completely different subject line angle produces a bigger effect size than comparing two near-identical phrasings, and bigger effects need smaller samples to detect. Second, run sequential testing across several campaigns with the same variant pair, then pool the data. Third, shift focus to flow-level testing instead of campaign-level testing, since flows accumulate volume continuously and reach significance faster over weeks rather than hours.
We see this pattern constantly during a Klaviyo audit: brands testing on lists too thin to produce reliable reads, then making strategic decisions based on results that were never statistically sound. List health matters here too. A bloated list full of disengaged addresses inflates your denominator without adding real signal, which is part of why suppressing inactive subscribers actually improves your testing accuracy, not just your deliverability.
Common mistakes DTC brands make with A/B testing
Most testing mistakes come from impatience, not bad math. Teams call tests early, test too many variables at once, or mistake a single campaign's noise for a durable trend.
A few patterns I see over and over:
- Calling the test too early. Checking results after two hours and declaring a winner before the full send has even been delivered. Then the "winning" subject line underperforms on the next three sends and nobody connects the dots.
- Testing multiple variables simultaneously. Changing the subject line, send time, and preview text all at once makes it impossible to know which change drove the result. You're not testing. You're guessing with extra steps.
- Ignoring send time variance. Comparing a Tuesday morning send to a Friday evening send and attributing the difference to the variant rather than the timing.
- Using percentage lift instead of percentage point lift. A jump from 2% to 3% conversion is a 50% relative increase but only a 1 percentage point absolute increase, and the math above uses the latter. This trips people up constantly because 50% sounds way more impressive than 1 point.
- Never retesting winners. Treating a single statistically significant win as permanent truth instead of validating it across future sends.
Klaviyo's built-in A/B testing tools handle a lot of the calculation automatically, but they still can't fix a list that's too small or a test that got cut short. That's a strategy problem, not a software problem.
Building a testing cadence that actually produces insight
A sustainable testing cadence tests one variable per campaign, runs each test to full statistical completion, and documents results in a shared log. Over months, this builds a dataset specific to your audience that's far more valuable than any "best practice" borrowed from a blog post. Including this one.
Most in-house teams struggle here, and honestly it's not about the math. It's bandwidth. Testing gets deprioritized the moment a launch or a holiday push eats the calendar, and once it falls off the radar it tends to stay off. If that sounds familiar, you might want to book your free consultation to see how a dedicated team handles testing as a standing process rather than something that gets done when things are slow.
A good cadence looks something like this across a quarter:
- Week 1-2: Test subject line format on your highest-volume campaign type.
- Week 3-4: Test send time within your top-performing segment.
- Week 5-6: Test CTA placement or offer framing.
- Week 7-8: Retest the previous winner to confirm durability.
- Ongoing: Apply validated winners to core automated flows once confirmed at the campaign level.
This structure respects sample size requirements by giving each test a full run and a real population, rather than squeezing five changes into one rushed send. It also feeds into broader email marketing strategies that depend on knowing what actually moves your specific audience, not a generic industry average.
Where testing fits into overall list health

Testing accuracy and list health are directly connected. A clean, engaged list produces faster, more trustworthy test results because the denominator is full of people who actually open and interact with your brand.
Brands sitting on a bloated, poorly segmented list often see muddy A/B results because inactive subscribers dilute every metric. That's why Klaviyo health work sunsetting, segmentation, sender reputation isn't just a deliverability exercise. It's a testing accuracy exercise too. A properly segmented list means your A/B test on "VIP customers" actually isolates VIP behavior instead of mixing in one-time buyers who haven't opened an email in six months.
The same logic applies to advanced segmentation decisions. Testing against your entire list instead of a relevant segment adds noise and makes reaching significance harder, because you're diluting the population with people whose behavior has nothing to do with what you're testing.
Running statistically sound tests
Running a statistically sound A/B test isn't about fancy tools. It's about respecting the math, giving tests enough volume, and resisting the urge to call a winner before the data actually supports it. For most DTC brands between $1M and $10M in revenue, that means knowing your baseline rates, calculating required sample sizes before launching a test, and building testing into a quarterly cadence rather than treating it as a one-off experiment you do when you remember.
The upside is real: a testing program that actually tells you something about your audience. The downside of getting it wrong isn't just wasted sends. It's that you'll confidently optimize toward noise while real opportunities sit untouched in your campaign strategy.
Frequently asked questions
How many subscribers do I need for a basic A/B test on open rates? For most DTC baseline open rates between 20% and 35%, you'll need roughly 1,200 to 1,500 recipients per variant to detect a 5 percentage point lift at 95% confidence. That means a total send volume of 2,400 to 3,000 across both variants.
Can I still test if my list is under 5,000 subscribers? Yes, but you need to test bigger changes rather than small tweaks, since bigger effect sizes require smaller samples to detect. You can also pool results across multiple sends of the same test to build up enough volume over time.
Why did my test show a clear winner but performance didn't improve after I rolled it out? Probably because the original test didn't reach statistical significance and the result was random noise. Retesting validated winners before fully committing to them prevents this.
Should I test click rate or conversion rate if my list is small? Test click rate first. It typically has a higher baseline rate than conversion, which means it requires a smaller sample size to detect the same percentage point lift.
How long should I let an A/B test run before checking results? Let the test run until the full send is complete and has had time to reach your typical engagement window, usually 24 to 48 hours for email. Checking within the first few hours almost always gives you misleading data.
Does Klaviyo automatically calculate statistical significance for me? Klaviyo's testing tools can flag when a difference reaches significance based on your sample, but they can't fix a list that's fundamentally too small for the lift you're trying to detect. The math still matters even with built-in tools.
Most DTC brands need between 1,000 and 5,000 recipients per variant to reach statistical significance on an email A/B test. The exact number depends on your current conversion rate, the lift you're trying to detect, and which metric you're testing. Smaller lists can still test, but they need bigger expected differences to prove anything.
A/B testing feels simple until you run a test on 400 subscribers and declare a winner based on an 8% swing that's actually just noise. Getting the sample size wrong wastes sends, misleads your strategy, and can quietly tank revenue if you roll out a "winning" variant that never actually won. Inbox competition isn't getting any lighter, and every send needs to earn its spot.
Why sample size determines whether your test means anything
Sample size is what separates a real effect from random chance. Without enough recipients, you can't tell if Variant B's higher open rate is genuine or just noise that would disappear on a second run.
Flip a coin ten times. Getting seven heads doesn't prove the coin is rigged. Flip it a thousand times and a consistent 70/30 split actually means something. Email tests work the same way. Small sample sizes produce wild swings that look dramatic but vanish the moment you retest. A list of 300 people split into two groups of 150 is almost guaranteed to show some difference between variants, even if both subject lines are functionally identical.
I see this constantly. Teams get a 15% lift, get excited, and bake that subject line format into every future campaign. Three sends later, performance is flat and nobody knows why. The answer is usually that the original "win" was never real. A disciplined Klaviyo agency builds testing into campaign strategy specifically to avoid this trap.
The math behind statistical significance
Statistical significance for email A/B tests depends on three inputs: your baseline conversion rate, the minimum detectable effect you care about, and your desired confidence level. Standard practice uses 95% confidence, meaning you accept a 5% chance the result is a fluke.
Here's the simplified formula marketers use, based on a two-proportion z-test:
n = 16 × p × (1-p) / d²
Where:
- n = sample size needed per variant
- p = your baseline conversion rate (as a decimal)
- d = the minimum difference you want to detect (as a decimal)
Let's run real numbers. Say your campaign open rate sits at 25% (p = 0.25), and you want to detect a 5 percentage point lift to 30% (d = 0.05).
n = 16 × 0.25 × 0.75 / 0.0025 = 1,200 per variant
So you'd need 2,400 total recipients just to test opens reliably. Click rate is almost always a smaller baseline number, often 2 to 4%. Smaller baselines need proportionally larger samples to detect the same percentage point lift, which is why click and conversion tests usually demand bigger lists than open rate tests.
Sample size reference table for common DTC scenarios
Here's a quick-reference table based on the formula above, assuming you want to detect a realistic lift at 95% confidence.
| Metric Tested | Baseline Rate | Detectable Lift | Sample Size Per Variant |
|---|---|---|---|
| Open rate | 20% | 5 points | ~1,280 |
| Open rate | 35% | 5 points | ~1,456 |
| Click rate | 3% | 1 point | ~776 |
| Click rate | 5% | 2 points | ~380 |
| Conversion rate | 2% | 1 point | ~3,136 |
| Revenue per recipient | varies | varies | 2,000 to 5,000 typical |
Conversion rate tests require dramatically more volume than open rate tests. That's why brands with under 10,000 active subscribers often struggle to test conversion-level changes on a single campaign. If your list sits below that threshold, you may need to test subject lines (higher baseline, smaller sample) before you can meaningfully test checkout page design or offer structure.
What happens when your list is too small
Smaller DTC lists can't reliably test subtle changes within a single send. A list under 5,000 active subscribers needs either a much bigger expected lift to detect significance, or it needs to aggregate results across multiple campaigns before drawing conclusions.
Three practical workarounds. First, test bigger swings instead of small tweaks. Comparing "20% off" versus a completely different subject line angle produces a bigger effect size than comparing two near-identical phrasings, and bigger effects need smaller samples to detect. Second, run sequential testing across several campaigns with the same variant pair, then pool the data. Third, shift focus to flow-level testing instead of campaign-level testing, since flows accumulate volume continuously and reach significance faster over weeks rather than hours.
We see this pattern constantly during a Klaviyo audit: brands testing on lists too thin to produce reliable reads, then making strategic decisions based on results that were never statistically sound. List health matters here too. A bloated list full of disengaged addresses inflates your denominator without adding real signal, which is part of why suppressing inactive subscribers actually improves your testing accuracy, not just your deliverability.
Common mistakes DTC brands make with A/B testing
Most testing mistakes come from impatience, not bad math. Teams call tests early, test too many variables at once, or mistake a single campaign's noise for a durable trend.
A few patterns I see over and over:
- Calling the test too early. Checking results after two hours and declaring a winner before the full send has even been delivered. Then the "winning" subject line underperforms on the next three sends and nobody connects the dots.
- Testing multiple variables simultaneously. Changing the subject line, send time, and preview text all at once makes it impossible to know which change drove the result. You're not testing. You're guessing with extra steps.
- Ignoring send time variance. Comparing a Tuesday morning send to a Friday evening send and attributing the difference to the variant rather than the timing.
- Using percentage lift instead of percentage point lift. A jump from 2% to 3% conversion is a 50% relative increase but only a 1 percentage point absolute increase, and the math above uses the latter. This trips people up constantly because 50% sounds way more impressive than 1 point.
- Never retesting winners. Treating a single statistically significant win as permanent truth instead of validating it across future sends.
Klaviyo's built-in A/B testing tools handle a lot of the calculation automatically, but they still can't fix a list that's too small or a test that got cut short. That's a strategy problem, not a software problem.
Building a testing cadence that actually produces insight
A sustainable testing cadence tests one variable per campaign, runs each test to full statistical completion, and documents results in a shared log. Over months, this builds a dataset specific to your audience that's far more valuable than any "best practice" borrowed from a blog post. Including this one.
Most in-house teams struggle here, and honestly it's not about the math. It's bandwidth. Testing gets deprioritized the moment a launch or a holiday push eats the calendar, and once it falls off the radar it tends to stay off. If that sounds familiar, you might want to book your free consultation to see how a dedicated team handles testing as a standing process rather than something that gets done when things are slow.
A good cadence looks something like this across a quarter:
- Week 1-2: Test subject line format on your highest-volume campaign type.
- Week 3-4: Test send time within your top-performing segment.
- Week 5-6: Test CTA placement or offer framing.
- Week 7-8: Retest the previous winner to confirm durability.
- Ongoing: Apply validated winners to core automated flows once confirmed at the campaign level.
This structure respects sample size requirements by giving each test a full run and a real population, rather than squeezing five changes into one rushed send. It also feeds into broader email marketing strategies that depend on knowing what actually moves your specific audience, not a generic industry average.
Where testing fits into overall list health
Testing accuracy and list health are directly connected. A clean, engaged list produces faster, more trustworthy test results because the denominator is full of people who actually open and interact with your brand.
Brands sitting on a bloated, poorly segmented list often see muddy A/B results because inactive subscribers dilute every metric. That's why Klaviyo health work sunsetting, segmentation, sender reputation isn't just a deliverability exercise. It's a testing accuracy exercise too. A properly segmented list means your A/B test on "VIP customers" actually isolates VIP behavior instead of mixing in one-time buyers who haven't opened an email in six months.
The same logic applies to advanced segmentation decisions. Testing against your entire list instead of a relevant segment adds noise and makes reaching significance harder, because you're diluting the population with people whose behavior has nothing to do with what you're testing.
Running statistically sound tests
Running a statistically sound A/B test isn't about fancy tools. It's about respecting the math, giving tests enough volume, and resisting the urge to call a winner before the data actually supports it. For most DTC brands between $1M and $10M in revenue, that means knowing your baseline rates, calculating required sample sizes before launching a test, and building testing into a quarterly cadence rather than treating it as a one-off experiment you do when you remember.
The upside is real: a testing program that actually tells you something about your audience. The downside of getting it wrong isn't just wasted sends. It's that you'll confidently optimize toward noise while real opportunities sit untouched in your campaign strategy.
Frequently asked questions
How many subscribers do I need for a basic A/B test on open rates? For most DTC baseline open rates between 20% and 35%, you'll need roughly 1,200 to 1,500 recipients per variant to detect a 5 percentage point lift at 95% confidence. That means a total send volume of 2,400 to 3,000 across both variants.
Can I still test if my list is under 5,000 subscribers? Yes, but you need to test bigger changes rather than small tweaks, since bigger effect sizes require smaller samples to detect. You can also pool results across multiple sends of the same test to build up enough volume over time.
Why did my test show a clear winner but performance didn't improve after I rolled it out? Probably because the original test didn't reach statistical significance and the result was random noise. Retesting validated winners before fully committing to them prevents this.
Should I test click rate or conversion rate if my list is small? Test click rate first. It typically has a higher baseline rate than conversion, which means it requires a smaller sample size to detect the same percentage point lift.
How long should I let an A/B test run before checking results? Let the test run until the full send is complete and has had time to reach your typical engagement window, usually 24 to 48 hours for email. Checking within the first few hours almost always gives you misleading data.
Does Klaviyo automatically calculate statistical significance for me? Klaviyo's testing tools can flag when a difference reaches significance based on your sample, but they can't fix a list that's fundamentally too small for the lift you're trying to detect. The math still matters even with built-in tools.

Find out exactly what your email channel is leaving on the table.

Email Marketing for Scaling DTC Brands


